Difference between revisions of "Mandelbrot"
| Line 1: | Line 1: | ||
== Overview == | == Overview == | ||
| − | [[Image:mandle.gif|170px| | + | [[Image:mandle.gif|170px|right|Mandelbrot in Mesham]] |
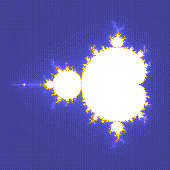
The mandlebrot example will compute the Mandlebrot set over any number of processes. This is a set of points in the complex plane, the boundary of which forms a fractal. The mathematics, which are quite simple, behind the Mandlebrot computation really do not matter for our purposes. The important issue is that firstly the calculation is embrasingly parallel (i.e. simple and natural to parallelise) and secondly will produce an image which the user can identify with. | The mandlebrot example will compute the Mandlebrot set over any number of processes. This is a set of points in the complex plane, the boundary of which forms a fractal. The mathematics, which are quite simple, behind the Mandlebrot computation really do not matter for our purposes. The important issue is that firstly the calculation is embrasingly parallel (i.e. simple and natural to parallelise) and secondly will produce an image which the user can identify with. | ||
The algorithm itself is actually quite simple, with a relatively large proportion of it dealing with specific colourisation of the resulting fractal. The example on this page is purposly basic so that the potential programmer can understand it. | The algorithm itself is actually quite simple, with a relatively large proportion of it dealing with specific colourisation of the resulting fractal. The example on this page is purposly basic so that the potential programmer can understand it. | ||
| + | |||
| + | <br style="clear: both" /> | ||
| + | |||
| + | == Performance == | ||
| + | |||
| + | [[Image:mandlezoom.jpg|400px|left|Mandelbrot Performance Evaluation, Mesham against C-MPI]] | ||
| + | |||
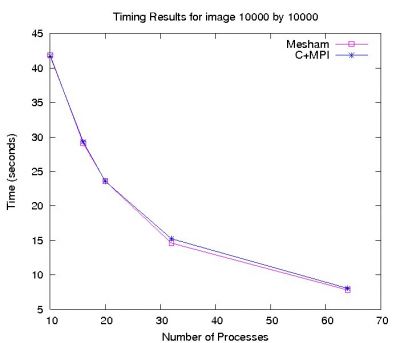
| + | The Mandelbrot example was evaluated against one written in C-MPI on a super computing cluster. Below is the graph detailing the performance of such codes, due to the close performance of the codes when run on an initial number of processors was the same and as such not shown. Due to the embarrassingly parallel nature of this problem the advantages of using Mesham in terms of performance do not start to stand out until a large number of processors is reached. | ||
<br style="clear: both" /> | <br style="clear: both" /> | ||
Revision as of 18:07, 11 January 2010
Overview
The mandlebrot example will compute the Mandlebrot set over any number of processes. This is a set of points in the complex plane, the boundary of which forms a fractal. The mathematics, which are quite simple, behind the Mandlebrot computation really do not matter for our purposes. The important issue is that firstly the calculation is embrasingly parallel (i.e. simple and natural to parallelise) and secondly will produce an image which the user can identify with.
The algorithm itself is actually quite simple, with a relatively large proportion of it dealing with specific colourisation of the resulting fractal. The example on this page is purposly basic so that the potential programmer can understand it.
Performance
The Mandelbrot example was evaluated against one written in C-MPI on a super computing cluster. Below is the graph detailing the performance of such codes, due to the close performance of the codes when run on an initial number of processors was the same and as such not shown. Due to the embarrassingly parallel nature of this problem the advantages of using Mesham in terms of performance do not start to stand out until a large number of processors is reached.
Source Code
var pnum:=4; // number of processes to run this on
var hxres:=1000;
var hyres:=1000;
var magnify:=1;
var itermax:=1000;
var pixel:record["r",Int,"g",Int,"b",Int];
var mydata:array[pixel,hxres,hyres] :: allocated[row[] :: horizontal[pnum] :: single[evendist[]]];
var s:array[pixel,hxres,hyres] :: allocated[single[on[0]]];

var p;
par p from 0 to pnum - 1
{
 var hy;
 for hy from (mydata#p).low to (mydata#p).high
 {
    var hx;
    for hx from 1 to hxres
    {
      var cx:=((((hx % hxres) - 0.5) % magnify) * 3) - 0.7;
      var cy:=((((hy + (mydata#p).start) % hyres) - 0.5) % magnify) * 3;
      var x:Double;
      x:=0;
      var y:Double;
      y:=0;
      var iteration;
      var ts:=0;
      for iteration from 1 to itermax
      {
        var xx:=((x * x) - (y * y)) + cx;
        y:= ((2 * x) * y) + cy;
        x:=xx;
        if (((x * x) + (y * y)) > 100)
        {
          ts:=iteration;
          iteration:=999999;
        };
      };
      var red:=0;
      var green:=0;
      var blue:=0;
      if (iteration > 999998)
      {
        blue:=(ts * 10) + 100;
        red:=(ts * 3) + 50;
        green:=(ts * 3)+ 50;
        if (ts > 25)
        {
          blue:=0;
          red:=(ts * 10);
          green:=(ts * 5);
        };
        if (blue > 255) blue:=255;
        if (red > 255) red:=255;
        if (green > 255) green:=255;
      };
      (((mydata#p)#hy)#hx).r:=red;
      (((mydata#p)#hy)#hx).g:=green;
      (((mydata#p)#hy)#hx).b:=blue;
    };
 };
};
s:=mydata;
proc 0
{
  var fname:="picture.ppm";
  var fil:=openfile[fname,"w"]; // open file
  // generate picture file header
  writetofile[fil,"P6\\n# CREATOR: LOGS Program\\n"];
  writetofile[fil,1000];
  writetofile[fil," "];
  writetofile[fil,1000];
  writetofile[fil,"\\n255\\n"];
  // now write data into the file
  var j;
  for j from 0 to hyres - 1
  {
    var i;
    for i from 0 to hxres - 1
    {
      var f:=((s#j)#i).r;
      writechartofile[fil,f];
      f:=((s#j)#i).g;
      writechartofile[fil,f];
      f:=((s#j)#i).b;
      writechartofile[fil,f];
    };
  };
  closefile[fil];
};
Notes
To change the number of processes, edit pnum. In order to change the size of the image edit hxres and hyres. The mandlebrot set will calculate up until itermax for each point, by increasing this value you will get a crisper image (but it will take much more time!) Lastly, the variable magnify will specify the magnification of the image - the value of 1 will generate the whole image and by increasing this image the computation is directed into working on a specific area in more detail.
Note: This example will produce an image in the Portable PixMap format (PPM), viewers of these on Unix based systems are easy to come by (i.e. eye of gnome) but on Windows are slightly more difficult. Windows users might want to rewrite some of the last bit on process 0 so that a BitMaP is created.
Download
You can download the Mandelbrot example here

